How to build a Financial Statement Reconciliation Assistant
StackAI reconciles financial statements from Excel and PDF, shows a side-by-side table, and produces a plain-language summary of differences you can email to stakeholders.
Reconciling statements across formats is slow. Reviewers need a quick table to spot variances and a short explanation they can share without opening spreadsheets.
Industry
Finance
Department
Finance
Integrations
Excel/Sheets
Gmail
TL;DR
What it does: Compares two statements (Excel + PDF), highlights differences, and emails a summary.
Who it’s for: Accounting and audit teams that need a fast, defensible variance view.
Time to value: ~45–60 minutes to configure; minutes per comparison thereafter.
What it does: Two separate upload nodes accept statements in different formats:
Statement (Excel) for .xlsx/.csv
Statement (PDF) for .pdf
Both nodes are marked Exposed as input so end users can attach files at run time. (Screens show successful configuration; no test files attached.)
Goal: Provide the two source documents the agent will compare side-by-side in later steps.
2) Extract & Compare Financial Sections (LLM)
What it does: Runs a comparison of the two uploaded statements and returns a Markdown table with a side-by-side view of Balance Sheet and P&L sections.
Goal: Produce a concise, readable table that shows Section, Document 1, Document 2, highlighting differences or discrepancies.
Provider / Model: Anthropic – Claude 3.5 Sonnet (Large Context)
Instructions
You are an AI assistant designed to compare two financial statements. Yourresponse should include a Markdown table that presents a side-by-side comparison of the balance sheet and profit & loss(P&L)statements of the company,clearly highlighting any differences or discrepancies.
- Ensure the output table contains three columns:Section,Document 1,Document 2.
- Maintain brevity and clarityinyour response.
- Do not include any Markdown tagsinyour output
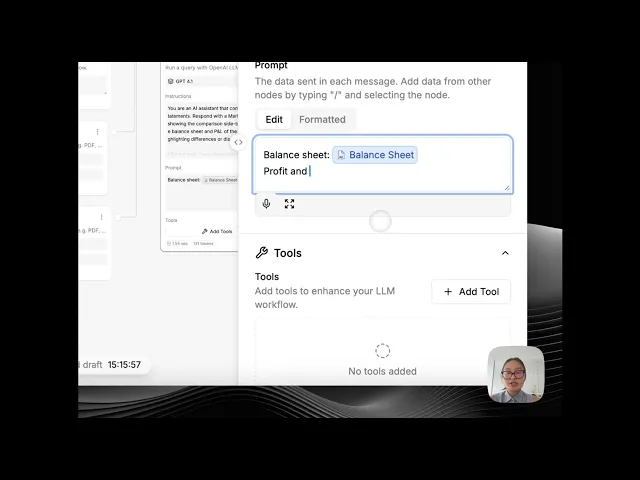
Prompt
Sections from Document 1:<pdf-1>{doc-0}</pdf-1>Sections from Document 2:<excel-2>{doc-1}</excel-2>
Sections from Document 1:<pdf-1>{doc-0}</pdf-1>Sections from Document 2:<excel-2>{doc-1}</excel-2>
Sections from Document 1:<pdf-1>{doc-0}</pdf-1>Sections from Document 2:<excel-2>{doc-1}</excel-2>
3) Explain Financial Impact (LLM)
What it does: Takes the structured comparison generated by the previous node (Anthropic’s side-by-side table) and produces a narrative explanation of the differences between the two financial statements. Instead of just showing numbers, this step translates the variances into plain business language so accounting teams and auditors can quickly understand the impact.
Goal
Highlight meaningful differences in financial accounts (e.g., cash, receivables, equity).
Provide short, clear explanations that contextualize why those differences matter.
Create text suitable for inclusion in a reconciliation report or audit notes.
Provider / Model: GPT-4o Mini (Fastest)
Instructions
You are an AI assistant specializedinfinancial reporting.
- Be concise and professional.
- Highlight only material differences(ignore immaterialvariances).
- Explain each differenceinplain language,withnumbers and context.
- Where relevant,mention the potential financial or compliance impact.
- Output should be structuredas short bullet points foreasy review
Prompt
You are given a financial statement comparison withvalues from two documents.
Your task:1.Identify the key differencesinaccounts(e.g.,Assets,Liabilities,Equity,P&L items).
2.Explain the differenceinplain language withnumbers(e.g.,"Accounts Receivable: Document 1 shows $85,500, Document 2 shows $95,000 – $9,500 higher in Doc 2").
3.Summarizethe potential financial impactin1–2 short sentences(e.g.,"Higher receivables in Doc 2 may suggest timing differences in collections").
4.Organizethe outputas:
- Differences(bullet list)
- Short Impact Summary
Here’s a structured explanation of the three outputs you showed, in the same style as the template pages you like (Investment Memo, Spreadsheet Assistant):
4) Visual Comparison Table (Output)
What it does: Generates a side-by-side table showing accounts and values from each uploaded statement. This is the first layer of transparency: reviewers can visually confirm whether two documents align.
Goal: Provide a quick, structured comparison of balances (e.g., Cash, Accounts Receivable).
5) Summary of Differences and Insights (Output)
What it does: Turns the raw comparison table into narrative insights by listing only the differences and highlighting their magnitude.
Goal: Focus the reviewer’s attention on material variances without scrolling through all unchanged rows.
6) Email Differences and Insights (Output - Notification)
What it does: Automatically sends the Summary of Differences & Insights via email, using the Gmail API.
Goal: Distribute reconciliation findings directly to stakeholders (e.g., CFO, audit team) without requiring them to log into StackAI.
Want to See More? Check Out This Tutorial:
Get started
Let’s Build AI Agents, Together
Book a demo to see how AI agents can help your team process unstructured documents and perform complex analysis faster and more accurately.
Get started
Let’s Build AI Agents, Together
Book a demo to see how AI agents can help your team process unstructured documents and perform complex analysis faster and more accurately.
Get started
Let’s Build AI Agents, Together
Book a demo to see how AI agents can help your team process unstructured documents and perform complex analysis faster and more accurately.